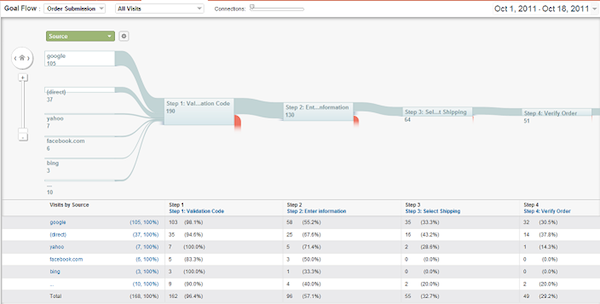
Another day of the week means another change to Google Analytics. This morning at the Web 2.0 Summit, Google announced flow visualization reports. Flow visualization reports are a way for site owners to quickly visualize how users navigate through their sites.
Two new reports will start unrolling to the Google Analytics interface this week:
Visitors Flow, found under the Visitors section of the Standard Reporting tab.
Goal Flow, found under the the Goals subsection of Conversions, also under the Standard Reporting tab. These reports are not only very graphical, they are interactive. Hovering over data points (known as nodes) displays drill-down information in a pop-up. For example, a pop-up might display the number of pages or visitors for a particular node or how many visitors exited or dropped out at that node with a mini pie graph. Because the representations can get large, the interface provides controls for zooming the report. There’s even controls for panning the angle and filtering to limit the number of connections between nodes.
Visitors Flow helps site owners visualize the paths visitors take through your site. Typically this includes the source, landing page, exit page and the pages in between. The report shows the relative volume of visits to your site and relative volume of views per page or for a collection of pages.
To use the Visitors Flow Report, start by selecting a dimension for the first column of the report. Google Analytics calls these the nodes. Nodes could be a particular source, campaign or keyword (if available). The link between nodes are a connection. As with most Google Analytics reports, you can select multiple dimensions for drilling down into more data.

The Goal Flow Report represents the paths visitors take in your site to complete some sort of conversion. The nodes in the Goal Flow path are defined by the site owner, similar to how the current Goal Funnel reporting works. The data available are also similar to Goal Funnels. You can view relative volume of visits by dimension, relative volume of page views per goal node and abandoment rates for each node. Goal Flow Reports add more useful information too, including conversion rates for each source and the ability to see where visitors to your site backtracked along your goal path.
Currently, you must have already defined URL goals to be able to see the Goal Flow report. Soon enough, however, the Goal Flow visualizer will utilize conversions, like events.
Perhaps the most important feature to note is that you have the ability to utilize advanced segments across both these reports. This was not available for goal funnel reporting before. The ability to drill-down from these reports to deeper information is also a nifty feature.

Google Analytics team member Phil Mui said these two reports “are only the first step in tackling flow visualization for visitors through a site.” More visualization reports are apparently coming down the pike.
Will this make you more or less inclined to use Google Analytics? Let us know in the comments below.

