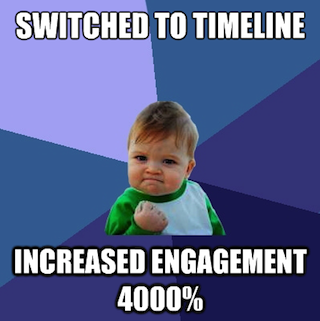
 We’ve previously reported that brands get 46 percent more engagement with Facebook Timeline brand pages, according to Simply Measured’s study of 15 early adopter brands. Actually, fan engagement increased 14 percent; content engagement was up 46 percent; and interactive content engagement skyrocketed 65 percent. You need to run out and post more photos and videos, stat! Right?
But wait… EdgeRank Checker also put out a study and they found that brand pages are seeing a drop in engagement, regardless of whether they’ve switched to Timeline. Their sample size is far larger, at 3,500 pages, so I’m tempted to buy into this one a bit more.
Wildfire had a look at 43 brands over a period of 42 days and they report double-digit increases in People Talking About This, Likes per post, and comments per brand post for 45 percent of brands representing 85 percent of total pages on Facebook. Megabrands with over 10 million fans, however, actually saw a decrease in engagement, reported ClickZ.
I think I want to believe in Vitrue’s study, though. Those guys claim to have seen engagement lift over 190 percent with the new Timeline! Of course, Vitrue also “studied” the value of a Facebook fan back in 2010 and came back with the much-contested $3.60 a head figure.
There’s also SimpleUsability’s eye-tracking study, which showed that, despite some creative Facebook Timeline efforts from brands, Timeline brand page users actually find some of the new elements confusing.
As a marketer, I’m left with the following insights: the new Timeline layout for brand pages will increase my fan engagement from 14 to 192 percent… unless it drops. Oh, and it also depends on my vertical, size of fan base, shoe size, preference for PB & J or just PB, and proximity of my physical store to the closest natural body of water.
Cue existential crisis: What does it all mean?
Universal Truths in Online Marketing
It might all mean something. It could mean nothing at all. Isn’t that the most frustrating answer ever? The truth is, there are more information sources online than you can shake a stick at.
However, there are universal truths in this insular world of ours:
- You’re going to read a lot of conflicting data, “fact,” and opinion.
- There is no magic formula.
- The only way to discover what works for your business is to try, test, tweak, rinse and repeat.
When studies come out this way – on a hot topic, with different methodologies and sample sizes, almost always by companies with a vested interest in the topic – it’s almost a knee-jerk reaction to pit them against one another. If Study A is right, Studies B & C must be wrong, or vice versa.
What You Can Take to the Bank from Conflicting Studies
 There is something to be taken from each one, even if the lesson is only that we should try some research and testing on our own accounts. We should all be grateful these companies are willing to share data at all.
Of course, the companies putting out these studies aren’t altruistic angels, slaving away over data and making pretty charts and graphs for the greater good. They want publicity, backlinks, authority and reputation. It seems a fair exchange for a look into the experiences of other companies. Plus, it gives us all something to talk about for a few days.
We can use their data not at face value as the be-all-that-ends-all or cornerstone of our own strategy, but as a benchmark for our own pages. It could mean as much to you as the catalyst for a full audit of your own accounts, or as little as a piece you skimmed over in 30 seconds and might only recall as, “I heard something, somewhere about that… 190 percent or something, what was that…”
It is a bit tragic that someone, somewhere, will stumble across one of the aforementioned studies on its own and make it the foundation of everything they do on Facebook until the next big, shiny headline comes along. But you’re smarter than that. You know to go looking for alternate sources of information and to consider the size, scope, and most importantly the source of a study before buying in.
Take these studies for what they’re worth, learn what you can from them. And then move on. Don’t drink the Kool-Aid.
 We’ve previously reported that brands get 46 percent more engagement with
  There is something to be taken from each one, even if the lesson is only that we should try some research and testing on our own accounts. We should all be grateful these companies are willing to share data at all.