 Click curves are a fundamental part of forecasting for SEO professionals; helping project the volumes of traffic to be expected if SEO manages to make a domain more visible within the SERPs for targeted keywords.
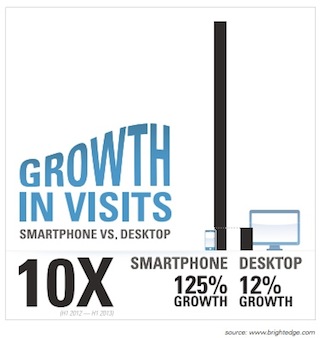
As device fragmentation has gathered pace and the penetration of smartphones and tablets has become more significant, forecasting based on click curves has become less accurate. This is because click curves to date have been based on CTR from desktop-based searches; yet for many brands the majority of traffic now comes from tablet or mobile; due to their smaller screen sizes they display different SERP formats.

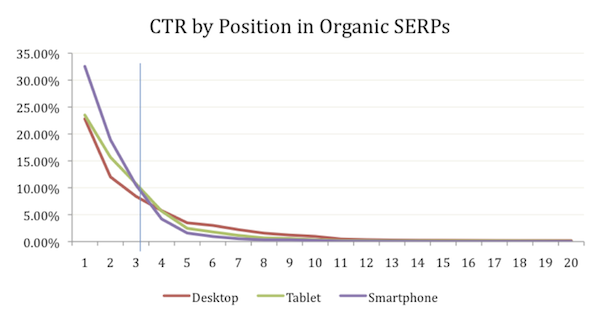
Following up from the very insightful mobile share report, now the folks at BrightEdge have crunched the numbers to develop the first publicly available click curves for mobile and tablet devices.
This data is based on exact match keywords with no change in rank and ranked page across one month.
Comparing visits to these pages from the keywords in question by mobile users with exact match mobile search volumes for the same period yields a CTR.
More than 2,000 keyword and page pairs were used to produce average CTRs for each position in the SERP.

The big takeaway from this data is that in a world where smartphone and tablet users are in the majority, ranking in positions 1 – 3 is even more essential than previously thought. Because CTR is much higher on smartphones for these positions, if your domain ranks in the top 3 for relevant keywords you will see a natural rise in traffic to your website over time as more people migrate to mobile devices.
Unfortunately the converse is true if you rank outside of those magic top 3 slots in the SERP. With smartphone usage well on its way to being ubiquitous this isn’t a trend website owners will be able to fight against.
The drop-off in CTR is really marked for smartphone users outside the top 10 positions – for desktop and mobile CTR falls by around 50 percent between positions 10 and 11, but for smartphone it’s over 60 percent. If your domain isn’t on page 1 for mobile queries, you really are nowhere.
It’s interesting to couple this click curve with smartphone search volumes for your target keywords from the Google Keyword Planner. This enables you to forecast how much traffic you can reasonably expect per month when particular ranking targets are achieved.
By adding this forecast to a similar forecast for desktop searches (found by using keyword tool data for desktops and laptops) you can produce an accurate forecast of traffic across both desktop and smartphone search. This produces much larger forecast traffic figures than simply looking at desktop in isolation and therefore strengthens the business case for SEO:
Old Forecast:

New Forecast:

Thanks to incorporating mobile search, our forecast is 50 percent higher than it would have been just utilising desktop search data and the desktop click curve.
While mobile search and device fragmentation adds an extra layer of complexity to the forecasting and reporting process, it’s great to be able to understand the variance in CTR that occurs between the major devices on the market today, and that good SEO performance is going to become even more important as we move to an increasingly mobile web.
 Click curves are a fundamental part of forecasting for SEO professionals; helping project the volumes of traffic to be expected if SEO manages to make a domain more visible within the SERPs for targeted keywords.


