‘Tis the season for quarterly reports, and this week, RKG released its Q2 report on the state of digital marketing, looking at channels like organic search, paid search, and social.
Just some of the highlights of the search and social channels include:
- Organic search produced 31 percent of all site visits in Q2.
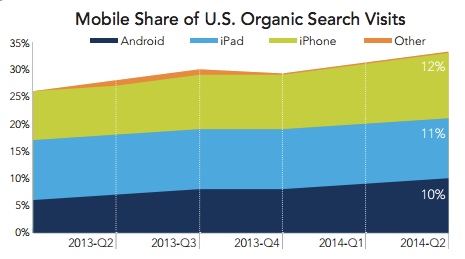
- Smartphones and tablets made up 34 percent of organic search traffic in Q2.
- Social media traffic made up 1.6 percent of all site visits in Q2.
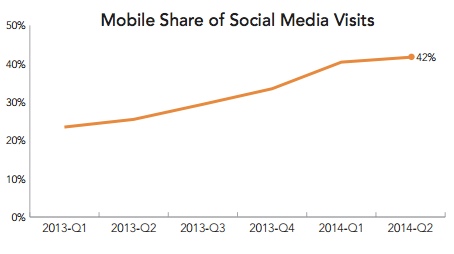
- 42 percent of social visits came from a mobile device in Q2.
Organic Search
Organic traffic comprised 31 percent of all traffic to U.S. websites studied, down from 36 percent in the first half of 2013 but holding steady for the past three quarters.

Mobile device traffic is growing, up three percentage points from Q1, comprising 34 percent of all organic search traffic to websites. Traffic from iPhones outpaces Android devices at 12 percent versus 10 percent, respectively.

The report shows “(not provided)” keyword data reached 90 percent at the end of Q2 for the websites sampled.

RKG noted in its report that “queries still being passed are skewed towards certain Web browsers and likely do not represent total Google queries very well.”
Social
While some sites experience nearly a quarter of their traffic from social, the report said, on average, social media traffic was on the decline from Q1 to 1.6 percent from 1.8 percent.

The report speculated that the drop could be due to the decay in organic Facebook reach.
When it came to the individual social network’s contribution to total social traffic, Facebook traffic was down 6 percentage points from Q2 2013, but still claiming the majority with a total of 51 percent of social media visits to websites.
Pinterest is up year-over-year and growing – from 13 percent in Q2 2013 to 21 percent on average in Q2 2014, “but its share was much smaller for many sites,” the report said.

In a mobile-social collision, the mobile share of social media visits was up in Q2, with 42 percent of social visits coming from a mobile device.

With display advertising, investment in the Facebook Exchange (FBX) increased by 72 percent in Q2. Cost per click on FBX was up, too, by 20 percentage points.
For more data points on organic, social, paid and comparison shopping engines, get the full report here.


