Content marketing fails: How to analyze and improve
What do you do when you follow a content marketing guide but it fails anyway? Here are all the ways you can analyze your failures and improve on them.
What do you do when you follow a content marketing guide but it fails anyway? Here are all the ways you can analyze your failures and improve on them.
Content marketing is one of the most viable ways to increase website authority in the long run. Over 69% of companies actively invest in content marketing and 86% of professionals indicate it increases brand awareness, one of the most important things for long term success.
There are countless amazing guides on how to create and execute a content marketing strategy. However, when a novice creates a strategy, works for three to six months, and sees no returns, they often are at a loss.
They’ve done everything by the book and it didn’t work. Does this mean content marketing is dead? Far from it, more and more companies are investing in it.
What’s the reason then? A content marketing guide is generic, your business needs are very much concrete. You need a way to figure out why your strategy didn’t work and improve on it, not just look for another guide to follow.
Here are four areas where content marketing efforts fail and a guide on how to analyze your failure and improve.
One of the most prevalent problems in the content marketing efforts of beginners is inconsistency. You’ve set the right goals, started measuring KPIs, but your team can’t seem to handle the load. Deadlines are often missed, the quality of content is inconsistent, and there’s little feedback to be found.
Simply telling a content team to put their act together is an easy but ineffective decision. You need to understand what went wrong and how it happened before you can fix the problem.
To do this, you should investigate your content marketing workflow with a strategy developed by Toyota engineers, value stream management. Also known as workflow mapping, it was originally developed to make car manufacturing more effective, but is now adapted to be used anywhere.
Here is what you should do to create a workflow map:
Here’s how such a map looks for resolving a support ticket.

Source: Tallyfy
You can draw one on a whiteboard, but any flowchart software would do. Give Draw.io a try or use Miro if you want a paid option. The most important part of this process is to create a map that shows what’s really happening in the workflow, not what it’s supposed to be.
Once you have that map, you can start looking for points of inefficiency. It may be the case that the copywriters are not receiving tasks early or there is no quality control down the content pipeline.
Whatever the reason is, workflow mapping gives you an insight into what’s going wrong. Once you figure out the reason, try different ways of solving the problem, and measure the result afterward.
According to Worldometers.com, there are over five million blog posts published each day. It takes a quality post to break through all that noise.
However, judging the quality of writing is highly subjective. How do you go about analyzing this without being biased? James Parsons, the founder of Content Powered, has an answer to that question.
Metrics like website traffic or the number of backlinks depend not only on the quality of content but on the content distribution as well. They do not show you the full picture.
James Parsons recommends looking at the following four stats that may indicate content quality is subpar.
If any of these stats are not showing any sign of increasing, it’s a telling sign that the readers are not finding your content good enough.
From then on, your analysis of the content itself is limited to how informative and readable it is. A readability test is something you can either do yourself or use the Hemingway app or Grammarly. You do need a premium on the last one to check readability, though.
Judging how informative a text is, boils down to subjectivity. You can make the process more objective by including competition research. Look at what narrative elements the competition is using (for example, infographics, quotes, and statistics) and try bringing them to your content.
The common problem many beginner content creators make is they focus too much on content and too little on marketing. It’s easy to fall into the trap of believing that once you build it, they will come.
The truth is, unless you promote it as well, they won’t come. Here’s how you can tell your content is lagging behind in terms of distribution.
The biggest statistic you should be looking for is the number of backlinks and their growth. If you’re doing outreach to bloggers, you can track each link you build in an Excel document and monitor status updates. That and Google Analytics for organic growth will give you the full picture.
Another stat that you should be tracking is the content position in SERPs. You can track it by proxy by looking at organic website traffic growth from target pages. However, if you want the full picture, you should be looking at keyword reach as well.
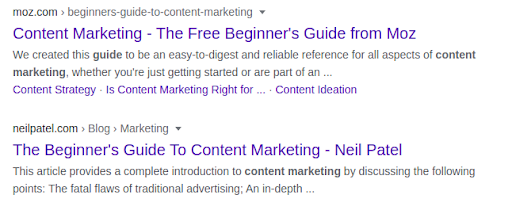
Here’s a list of keywords one of the top-ranking Moz.com pages on increasing domain authority ranks for as shown by the Moz tool.

Source: Moz.com
Use this or another keyword analysis tool like the ones from Ahrefs or SEMrush to see what keywords your content ranks for. In most cases, these tools can also show you related keywords, so they give you a solution to the problem as well.

Source: Moz.com
If your content isn’t gaining enough backlinks, you can look back at the outreach you did and try to either make your email copy better or find websites that would be more interested in your content. You want to walk away with measurable results, so make sure to split test the email outreach campaign.
If organic traffic growth is what’s lagging behind, you have three ways of improving the content: optimize the meta title and description, improve keyword density and add LSI keywords, or update the content.
LSI (latent semantic indexing) keywords are those that are not directly related to the search, but the SERPs associate them with the topic. Here’s an example from the most popular LSI tool.

Source: LSIGraph
Meta title and description, while not directly tied to content, may play a crucial role in attracting visitors to your website from organic search results. They are responsible for the title and snippet that users see on the search result page.
Updating old content can work wonders for an ill-performing page as well. If you can spare time, experiment with these three ways on different underperforming content pieces to see what yields the best results.
From the previous points, you now know what metrics to track to pinpoint your problems with website traffic, backlinks, and content quality. However, there’s another KPI that is commonly used in content marketing campaigns, conversions.
Let’s say you’re going for soft conversions like joining the subscriber list or downloading a white paper while leaving an email address. The first thing that you should analyze is everything non-content related. Split test the page to figure out whether changing the CTA changes the conversion rate.
When that doesn’t work, you’ll have to do some qualitative analysis. It may be the case that the content piece and the target conversion may have different search intent. Pull up the list of keywords that the content piece ranks for and analyze the intent behind it.
If your lead-generating article attracts the crowd that is not that deep into the sales funnel, you may be setting yourself for failure. In this case, you’d have to repurpose the content to rank for keywords with more relevant search intent.
Judging how content contributes to actual sales, however, is a much harder task. You can start with metrics that correlate with a lead generation like organic traffic growth and time on the website.
Since these are covered earlier, let’s focus on a more direct approach, looking at multi-channel attribution reports and customer journey mapping.
The former you can easily find in Google Analytics under Conversions > Multi-Channel Funnels > Assisted conversions. This report will show you how much of a role each marketing channel played in a conversion. You can also check Google’s new tool called Attributions for that.
Customer Journey Mapping is a trickier thing to do. Without going into too much detail, you should primarily look at two reports. These two crucial reports are “Behavior Flow” and “Reverse Goal Path”.
“Behavior Flow” shows how users interact with the website and track their browsing and exit points. If you filter the flow chart by source, you can also see how different traffic behaves.

Source: Serpstat
Reverse Goal Path report does a similar thing but on a smaller scale. It backtracks the most common paths to a goal of your choosing.
You can use these two to create a customer journey map. Just like a workflow map, this map is a flowchart that shows the way a customer makes through a website, from the first interaction to conversion. Here’s how the US government created one.

Source: Digital.gov
It’s a complex tool, but you can narrow the scope to content. Draw a map of how users interact with content and look for points of exit.
If you find a problem there, you’ll have to make deep structural changes in your content marketing approach. Try incorporating these steps into your strategy to achieve better lead generation rates.
Seeing all your hard work fail is definitely heart-wrenching. But don’t give up on content marketing just yet. Analyze common areas where content marketing fails, look for places you’ve failed, and improve.
That’s the only way you can create a content marketing strategy that is right for your business.
Michael Doer is a content marketing expert who covers digital marketing topics from general marketing tips to building a marketing team. He can be found on Twitter @MichaelDoer.
Leave a Reply
You must be logged in to post a comment.