Top 10 essentials for SEO reporting
I have created a simple SEO reporting template to help us focus on the key elements of showing value from organic search.
I have created a simple SEO reporting template to help us focus on the key elements of showing value from organic search.
Measurement is an imperative element of all marketing activity.
Not only do we need to understand the commercial impact of the activity we are undertaking in order to learn and optimise, but our client/business must also see the value being driven over time.
Reporting is the collation of this measurement into a tangible view of performance and results, so it’s imperative that you’re reporting in the right way.
To help with this I have created a simple SEO reporting template (registration required) to help us focus on the key elements of showing value from organic.

Ultimately, any report needs to focus on the KPIs through which your client or business is measuring the organic channel.
The KPIs may be engagement-based, or commercial, for example. These KPIs, and their associated targets, will of course vary from business to business and client to client, however there are core organic metrics that show how SEO is driving impact.
In addition to KPIs, it is always worth expanding your reporting to cover other relevant metrics, which can add value. It’s very important to ensure that any additional metrics support your KPIs and are understood by the reader.
In the reporting template, we have featured the most common SEO KPIs, in addition to value-adding metrics that support the demonstration of organic growth.
Below, I list each of the 10 core elements and how you can source and use this data effectively.
The most common source of traffic information is Google Analytics, however you may have a different analytics platform such as Coremetrics. For the purposes of this post, I will refer to Google Analytics (GA).
The key element of traffic reporting is sessions, using week-on-week, month-on-month and year-on-year comparisons. Dependant on your business/client requirements, you may wish to also look at quarter-on-quarter. Indeed, these date comparisons apply to most of the essentials in this Top 10.
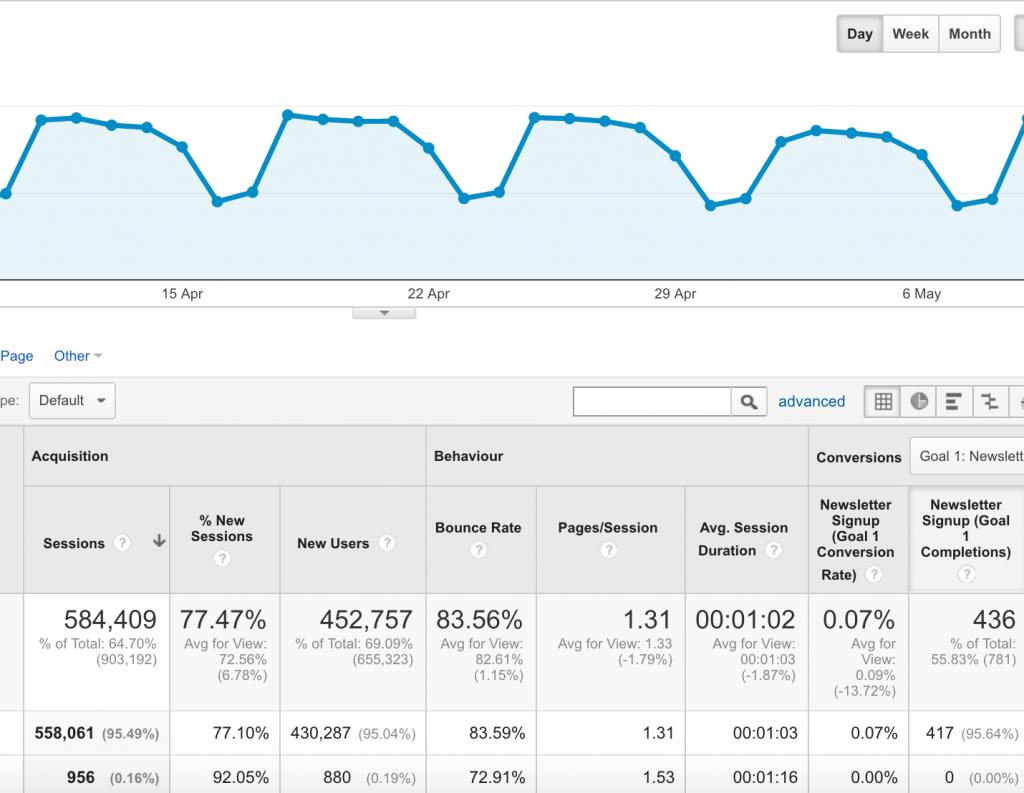
The most reliable way I’ve found to track sessions accurately in GA, is through the Campaigns section. Go to Acquisition in the left nav, then click on Campaigns, followed by Organic Keywords.
You will see this takes you to a list of keywords (including not provided), however I always prefer to switch the primary dimension to Landing Page, which shows all sessions that have arrived on to a page within your website from an organic source.
Whatever you do, make sure you pick a method of recording sessions from GA, and stick to it over time. Consistency is key, as GA can be erratic sometimes.
The Stickyeyes Group proprietary tool ‘Roadmap’ reverse engineers SERPs by sector, to understand which ranking factors are important for each search result.
Roadmap has shown that one particular factor that has grown in importance across all niches and is proven to affect rankings, is engagement.
This is essentially how visitors are behaving on your site. It’s important for Google to see that your visitors are landing on your site, finding the content they need, and engaging with it.
Key metrics here are:
It’s important to note that whilst the two average metrics are ‘higher-the-better’, there is a limit to this. If either of them is too high, it can indicate that visitors are struggling find what they are looking for on your site.
The best place to find this information is again in GA and it can be found in the same area as I suggested for traffic. You will see three columns under a heading of ‘Behaviour’ and these columns are the three metrics mentioned above.
Whatever traffic and engagement organic is driving, what ultimately matters is commercial benefit and again GA is a great source for this, dependant on you having the correct ecommerce and goal tracking in place.
Where a conversion for you is a lead or enquiry (i.e. not a purchase), then key metrics are:
If your conversion is a purchase, for example on an ecommerce site, then these additional metrics are relevant:
These ecommerce numbers can be found again in the same area of GA, however near the top of the page, under the Explorer tab heading, you will see an ‘E-Commerce’ option. Click this to reveal the metrics above.
For lead generation conversions, you will need to navigate to the Conversions area in the left nav, then click on Goals and then Overview. You can then drill down to Source/Medium to show goals achieved from organic traffic.
In the template, we’ve focused on ecommerce conversion metrics, however you can of course edit this for lead generation if needed.
It’s imperative to understand which landing pages are driving traffic and ultimately commercial value. You will have pages that historically drive value and you will need to track their performance, however it’s also important to ensure new pages are working as intended and attracting traffic.
A great way to do this in a summary report is to list the top performing landing pages. In the template we have included an area for your top five landing pages and how they’re performing vs prior year, month and week, as well as their bounce rates.
Again you can find this in the Acquisition > Campaigns > Organic Keyword section, with Landing Page selected as the primary dimension.
This information is especially useful when trying to understand the impact of particular key term rankings, as all terms will rank a particular page and impact how much traffic arrives on that page dependent on the ranking and how much search volume the term has.
I will come to individual rankings in a moment, however first I want to look at overall search visibility, which gives a great summation of organic performance.
It looks at the number of terms you rank for, where you rank for them, what search volume they have, and the estimated traffic they will drive as a result. A score is then calculated and trended over time.
My preferred source for this is Searchmetrics, where you can enter a domain to get an updated score. You may need a paid account to access the full version, but it’s a great way to trend a relevant summary score for your organic performance.
Searchmetrics also provides some other useful tools. I especially like the Winners & Losers section, which shows which keywords have driven a week’s visibility growth or decline.
SEMrush is a great SEO research tool, for both your own site, your client’s sites, and competitors. Similarly to search visibility, a great way to see how you are performing overall in organic is to look at ranking spread.
SEMrush provides a breakdown of how many terms the site ranks for on the Top, P4-10, P11-20, P21-50 and P51-100.
Being able to show that a) the number of terms you have in the top 100 is increasing and b) the number of terms you have in the top 3 or on page 1 is increasing, is a great way to show overall search presence.
Simply enter your domain into the search bar in SEMrush, navigate to the Organic Research section and select Positions. This will give you a graph showing wither daily or monthly ranking spread within the Top 100 (dependant on the date range selected).
Trending this over time, and doing comparisons vs prior week/month/year, is an effective was to show organic growth.
Whilst modern SEO is moving away from specific term rankings, it is often a key KPI for many businesses, so understand rankings for key terms is still important to report on.
There are a multitude of sources that will allow you to do this, including 3rd party tools like Accuranker, however the most readily available is Google Search Console (previously Webmaster Tools).
Navigating to the Search Analytics area will show you a list of keywords and how many clicks each has driven in the date range.
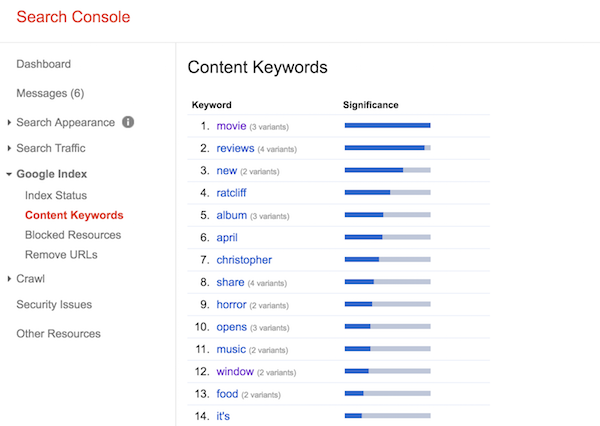
The filter bar at the top lets you add the position of that term in SERPs, by ticking the Position box. Finding the average position of each of your key terms this way will allow you to trend these over time and do weekly/monthly/annual comparisons.
This area also lets you see which key terms are most effective for you, and this can be especially useful if the most effective terms are different to the ‘vanity’ terms you may associate with the site you’re reporting on.
On the same screen, the list of keywords is sorted by clicks by default, so the top keywords in that list are the ones that have sent the most organic clicks to your site.
Link metrics are a great way to show how improved on-page optimisation and link acquisition are allowing the site to rank better and have improved visibility. Popular metrics to track and trend are:
Context is key in reporting. I’ve included space for commentary by each element of the report template, giving you the opportunity to add insight against the numbers.
These are the sorts of questions you need to answer within commentary.
Finally, metrics in isolation are not much use to anyone, what is key is to show progress. Trending key metrics over time is the best way to show growth. You can also overlay key events, like Google algorithm updates for example, to add more context to how trends are behaving.
In the template we’ve included trends for ranking spread, ecommerce metrics and traffic, but feel free to change these to suit what’s important to you, your business or your client.
A few points about the template:
A couple of things you may wish to add the report as you customise it, either replacing elements currently in it, or perhaps adding new tabs, are:
The above can be found using a crawler like Screaming Frog or Moz.
Download the SEO reporting template here.
Mark Leech is Operations Director at ZazzleMedia and a contributor to SEW.
Leave a Reply
You must be logged in to post a comment.