For six years, SEOmoz has produced a biennial survey that outlines the current priority ranking factors within the industry. This year, the results are also paired up with correlation-based analysis (taken from top 30 sites in 10,980 queries in Google) and opinions from the panel. What that basically means is more insights into the question of “Why?”
The findings, overall, are reflective of Google’s stance on rank by engagement, social reach, and the true user value of the URL.
The 2011 study is much more technical and requires an in depth overview versus the 2009, and all previous studies. The reason? More data, more specific data research, and so many new factors entering into the ranking equation. Let’s jump right in.
Correlation & Survey Data

Domain level keyword usage
- Correlated data shows .22 – dropped from .38 (June 2010), stated as one of the biggest drops in the entire data set.
- Survey data shows participants felt exact-match domains (EMDs) are still highly favored to other strategies in terms of impact on rankings (97.0), keyword present anywhere in domain (71.0)
Domain level keyword agnostic features
Domain ranking factors in regard to on-site factors (i.e., length of domain name, content relevance, error pages, etc.)
- Correlated data shows negative figure from the following: Domain Name Length (-.07), Numeric Characters in Domain (-0.03), and Number of Hyphens in Domain (-0.01).
- Survey data shows top three are: Uniqueness of Content Across Site (89.4), Freshness of Content (74.9), CTR – Measured by Users Returning to SERP (62.2).
Supplemental Domain Level Authority Features
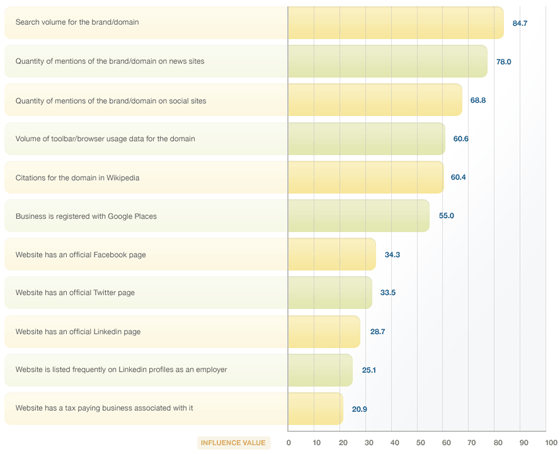
Official name for this category is “Domain Level Authority Features – Non Link Based, an easy way of understanding this would be, supplemental search engine signals
- Survey data: Top three results are Search Volume for the Brand (84.7), Quantity of Mentions for the Brand on News Sites (78.0), Mentions of Brand on Social Sites (68.8).

Page Level (individual URL) Ranking with Social Metrics
Likes, Shares, Retweets, Reach, Mentions, Etc. This survey was done before Google +1
Interestingly enough, this is where correlated data is nice to see compared against the Survey Data. Many of the featured quotes state that Twitter is the most important social signal, but the correlated data definitely shows there is some consistency between Facebook metrics and high ranking sites. It could be, as Rand Fishkin says, “correlation not causation.”
In reality, many popular sites are still not scaling their popularity over to Twitter and Facebook either, so it could truly be correlated events and other variables involved.
- Correlated data shows the following rates: Facebook Shares (.28), Facebook Activity (.28), Facebook Comments (.24), Facebook Likes (.21), Tweets (.17), Google Buzz (.16), and Topsy Influential (.13) for top ranking sites on the query set.
- Survey data shows industry experts believe the following are most influential: Authority of users tweeting links to a page (84.1), Quantity of Tweeted Links to a Page (79.0), Quantity of Facebook Shares for a Page (61.6) as the top three influential social metrics to date. Upvotes on sites like Digg, Reddit, Stumble was significantly lower (40.9), but there are many other reasons for becoming popular on such sites.
Page Level Ranking with Linking Factors
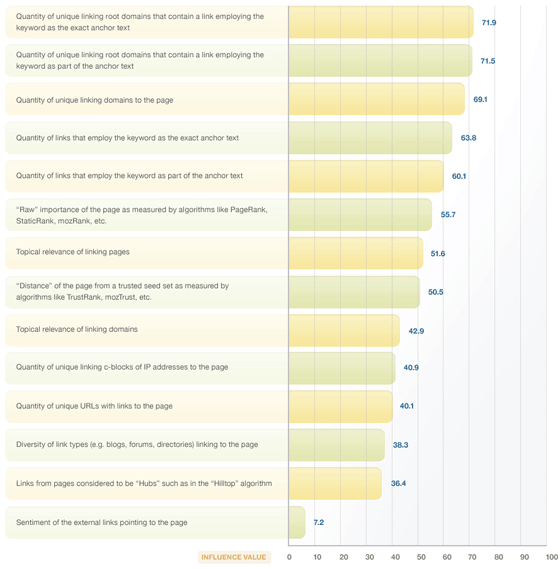
Correlated data shows patterns in top ranking sites for SEOmoz Site Intelligence metrics, survey data shows what experts believe to be the top ranking factors in regards to backlinks.
It was a bit surprising to not see more negatives in correlated data for this subject, but this can be explained by the fact that they only retrieved the top 30 sites for each query.
- Correlated data top three: Page Authority (.28), Total Number of Root Domains Linking with Partial Anchor Text (.25), MozRank Passed by External Links with Partial Anchor Text (.25).
- Survey data top three: Quantity of Unique Linking Root Domains that Contain a Link Using The Keyword As Exact Anchor Text (71.9), Quantity of Unique Linking Root Domains That Contain a Link Using the Keyword as Part of the Anchor Text (71.5), Quantity of Unique Linking Domains to the Page (69.1).

Predictions & Opinion

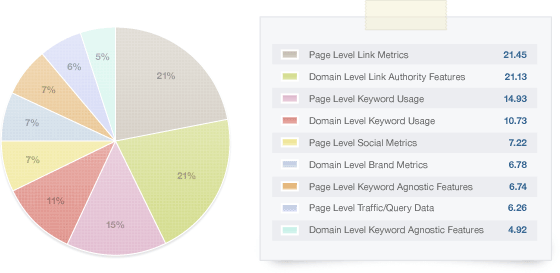
Here we can see the significance of each category. Versus 2009’s overview, there have been minor shifts, the biggest being social metrics – and we all have an opinion on which way this is going.
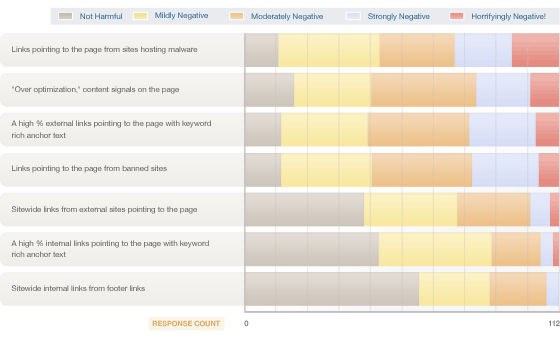
If you were looking for what not to do, see the Negative Page Level Factors in the Predictions and Opinions.

I recommend not only reading through the entire survey, but to refer back to it in the future as you work through your SEO and SEM campaigns. It will help you keep in mind what is pertinent to search engine’s and search engine professionals. It’s not scripture, but it’ll do.
It’s still the same take-it-as-a-grain-of-salt, except correlation data begins to scratch the surface. Because it’s nearly impossible to test all relevant domains with poor rankings, it’s not as black and white as we would like it to be.
Tapping the top 30 sites for a given query may show small patterns, but chances are for any given keyword, there are many reasons each one ranks towards the top, so measuring one at a time while neglecting the rest leaves a lot of room for misinterpretation.


