 To make marketing data work, you need to be able to measure and understand performance against a standard set of metrics. The challenge lies in marrying data from web analytics with search and social signals, and then being able to tie that to business value (for example, the correlation of search rankings with visits and conversions).
Did you know the average smartphone today is more powerful than the most powerful computer in 1985? Have you heard a human in this day and age processes more data in one day than he or she did in an entire lifetime 500 or so years ago?
The ability to process more data begets more data. More data means more to analyze, more to understand. If you’re in the search marketing industry, chances are you’ve heard the term “big data” countless times. And even though you know “big data” is out there, you may not know the first step in what to do with it.
And you aren’t alone.
Marketers didn’t invent the concept of big data. Figuring out what to do with the mounds of data that exist isn’t only the plight of marketers, but also nearly every sector in the world. In fact, humans have been striving to harness data that computers have been creating for decades and decades.

But before we talk about sane ways to make heaps of data work for your marketing initiatives, a brief overview of how data has grown up and turned into the problem child it is today.
Big Data, Big Headache
Webopedia defines big data as the “massive volume of both structured and unstructured data that is so large that it’s difficult to process using traditional database and software techniques. In most enterprise scenarios the data is too big or it moves too fast or it exceeds current processing capacity.”
While technological advances over time have amassed the data we face today, a popular 2013 statistic stated 92 percent of the world’s data was created within two years. This illustrates just how fast data can grow.

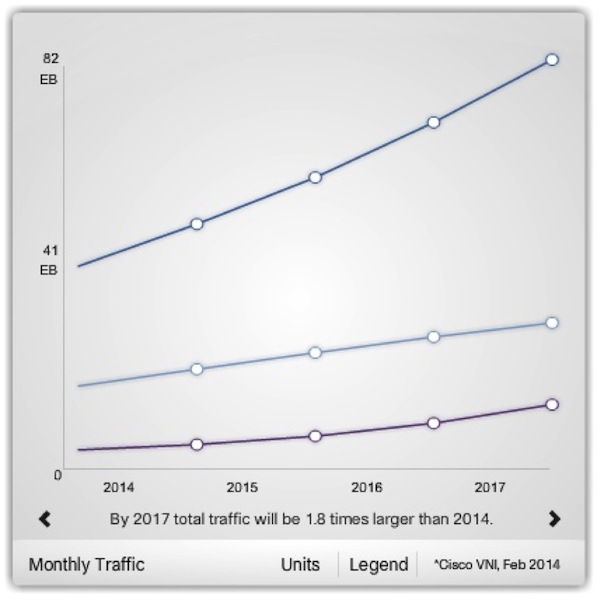
What we track is growing at alarming rates. Cisco data projects total traffic across fixed Internet, managed IP, and mobile networks to be 1.8 times larger in 2017 than in 2014. That’s a lot of data to process.

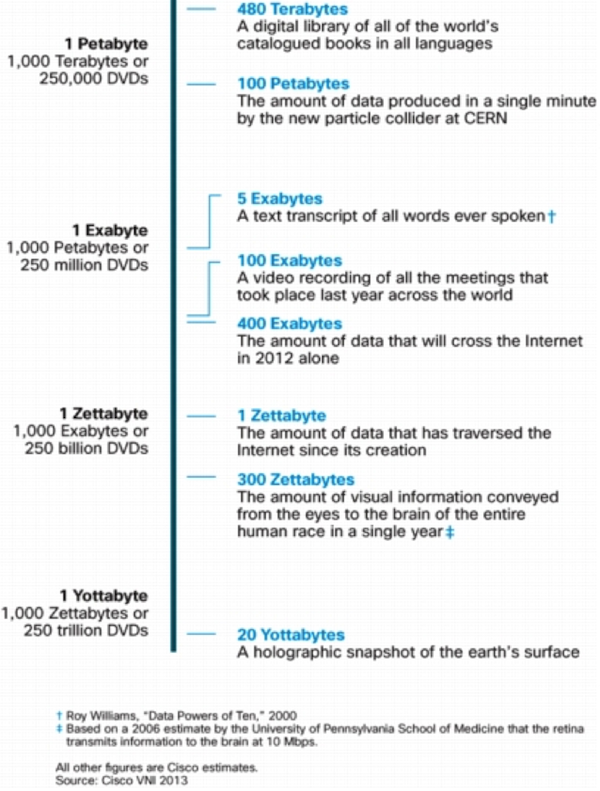
The “EB” in that chart represents exabyte. Keep in mind:
- TB = Terabyte (1,000 GB)
- PB = Petabyte (1,000 TB)
- EB = Exabyte (1,000 PB)
Using Data Integration to Wrangle Big Data
With all this data, the challenge is (and has been for many decades) harnessing it in a meaningful way. One such way is through data integration. Data integration works to combine multiple sources of data into one place for more significant information.
Just like web marketing strategies don’t begin and end in one silo, neither do data sets from multiple networks, channels, and devices. Together, they represent user behavior across the lifecycle of engagement with a brand online.
But it’s not just pulling together multiple sources of data in one place that’s the answer; it’s being able to do so in a way that yields actionable insight. With data coming from multiple places, it needs to be streamlined into a format that’s similar and comparable. View this video by CommonCraft.com for a simple, illustrative example of this concept in action.
The majority of marketers agree data integration is central to what they need to do. BrightEdge surveyed more than 300 marketing practitioners from its customer base of global brands in December 2013/January 2014 and found respondents felt multiple data sources were important to fuel initiatives like content marketing:
- More than 90 percent said Google Webmaster Tools data integration was key.
- Forty-two percent mentioned Adobe SiteCatalyst as a compelling source for added data.
Keep in mind that informed data integration doesn’t mean viewing data from one tool and then viewing data from another tool separately. To gain actionable insights, you really need an analytics platform that pulls in data from multiple sources, processes it, and outputs it in a way you can act on.
Making Sense of Big Data
To make marketing data work, you need to be able to measure and understand performance against a standard set of metrics. The challenge lies in marrying data from web analytics with search and social signals, and then being able to tie that to business value (for example, the correlation of search rankings with visits and conversions).
There are two ways to start making big data work for you.
1. Selecting the Data
Know which types of data from what sources matter to your marketing efforts. Then, make sure the sources you’re pulling data from are trusted. In general, common sources of important data for digital marketing include:
- Geographic data
- Keyword data
- Link data
- Local search data
- Mobile data
- On-page data
- Rank data
- Revenue data
- Traffic data
- Social network data
- Universal search data
2. Excluding the Data
To avoid being overpowered by data, you have to exclude some data. Understand the key performance indicators (KPIs) that matter to your unique marketing strategy. Then, let the strategy and KPIs drive the data paths you follow.
If, for example, your business were built on launching new products, the marketing approach, the KPIs and the data would vary greatly than a business that runs a news site.
When you approach data within an organized framework, you make it work for you instead of being worked over by it. This approach reveals opportunities in your marketing campaigns. And the idea is that once you begin to set boundaries on data, you can actually flourish more, and begin to examine the business value big data can reveal.
Big Data Use Cases: The Good, The Bad and The Ugly
Data in the wrong hands can get ugly. But when harnessed well, can be a beautiful thing. In a 2011 report by the McKinsey Global Institute, the health care industry showed early success in its use of big data:
- The California-based integrated managed-care consortium Kaiser Permanente connected clinical and cost data early on, thus providing the crucial dataset that led to the discovery of Vioxx’s adverse drug effects and the subsequent withdrawal of the drug from the market.
- The National Institute for Health and Clinical Excellence, part of the United Kingdom’s National Health Service, has pioneered the use of large clinical datasets to investigate the clinical and cost effectiveness of new drugs and expensive existing treatments. The agency issues appropriate guidelines on such costs for the National Health Service and often negotiates prices and market-access conditions with PMP industries.
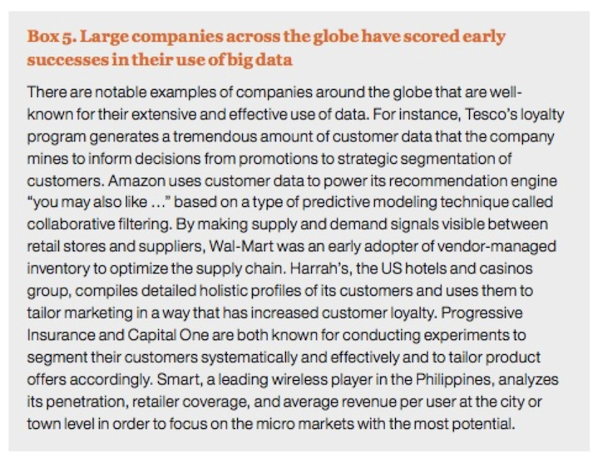
Corporations have harnessed it, too, as outlined in the following examples from the McKinsey report:

But there are also examples of big data gone wrong, as illustrated by this article in the Harvard Business Review. Here’s just one scenario:
“To help allocate its resources efficiently, the City of Boston released the excellent StreetBump smartphone app, which draws on accelerometer and GPS data to help passively detect potholes, instantly reporting them to the city. While certainly a clever approach, StreetBump has a signal problem. People in lower income groups in the US are less likely to have smartphones, and this is particularly true of older residents, where smartphone penetration can be as low as 16%. For cities like Boston, this means that smartphone data sets are missing inputs from significant parts of the population – often those who have the fewest resources.”
And there’s no better example of harnessing big data than IBM’s “Watson” – the machine best known for its game-show trivia triumph at “Jeopardy!” in 2011. Now, it’s been reported that IBM intends to use the power of Watson to win the big data game.
Conclusion
Big data doesn’t have to be big and scary if you have simple elements in place:
- Understanding what data sources are important to your brand.
- The means for data integration and processing from sources you trust.
- An understanding of your business and the right marketing approach.
- Knowing what KPIs support that marketing approach to set boundaries on data analysis.
The rest is, as character Sherlock Holmes would say, “Elementary, my dear Watson.”
 To make marketing data work, you need to be able to measure and understand performance against a standard set of metrics. The challenge lies in marrying data from web analytics with search and social signals, and then being able to tie that to business value (for example, the correlation of search rankings with visits and conversions).


